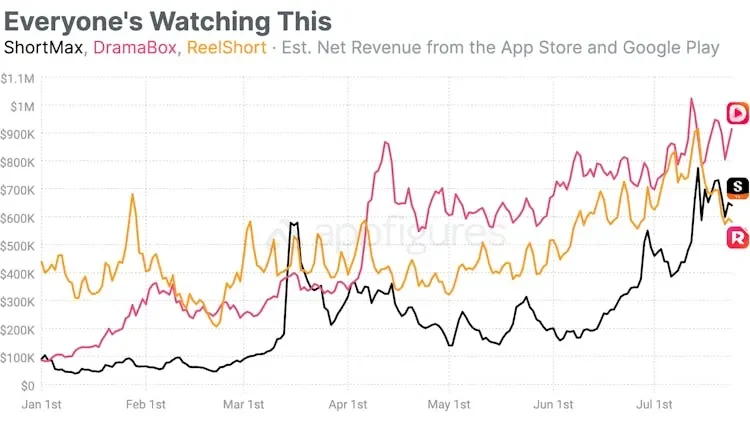
What was announced or recorded
Appfigures, a second mobile-analytics firm, published an insights post on 11 April 2024 by analyst Randy Nelson covering the short-drama category's first quarter. Separately, the firm maintains a report landing page, a living document that as retrieved on 16 September 2026 states category consumer spending across two full years.
What the documents establish
The April 2024 post, built on the firm's Explorer platform, tracked 66 short-drama apps generating revenue in the first quarter of 2024, up from 21 a year earlier; it states global consumer spending of $146 million for that quarter, about $65 million in March 2024 alone, and cumulative spending to that point of $245 million across 121 million downloads. It names ReelShort as the top earner at $52 million for the quarter, 37 percent of the top ten's combined total, DramaBox second at close to $34 million, 24 percent, and ShortTV third at $17 million, 12 percent. The report landing page states, as a running figure, that US consumer spending on the category rose from $580 million in 2024 to $1.15 billion in 2025, a 100 percent year-on-year increase, and that spending through July 2026 had already reached $2.2 billion cumulatively, with the 2026 download pace matching the comparable period of 2025.
Announced versus delivered
The two documents measure different things and should not be added together: the April 2024 post is a fixed, dated snapshot of a single quarter across a named set of apps, worldwide; the report landing page is a living, continuously updated, US-only figure. Sensor Tower's separately published estimate, discussed elsewhere in this dossier, states a global scope; Appfigures' headline growth figure here is explicitly domestic, so a reader treating the two firms' headline numbers as directly comparable would be comparing different markets.
What to watch
Editorially, the landing page's own framing, that 2026 downloads were already 'matching' the comparable 2025 period, is a claim about pace, not proof that full-year 2026 spending will exceed 2025; it compares a partial year against a partial year, and only a later dated post would confirm whether that pace held.
- Is a cited short-drama revenue figure scoped to the United States, as Appfigures' headline is, or worldwide, as Sensor Tower's is?
- Does the named app list behind a growth percentage stay constant across the years being compared?
- Has the 66-app cohort from April 2024 grown, and does a newer count include or exclude apps that later closed?
Two analytics firms measuring the same category from different market scopes will produce numbers that look like they disagree even when both are accurate; naming the scope before quoting the figure is what keeps the comparison honest.
Sources & evidence
appfigures.com · Official source
Source date: 11 Apr 2024 · Checked: 16 Sept 2026
- States Q1 2024 category consumer spend, app count, and named top-earner figures with method.
appfigures.com · Official source
Source date: Not stated by source · Checked: 16 Sept 2026
- Living report page stating US category consumer spend for 2024, 2025 and through July 2026, as retrieved.